The TPU profiler helps identify bottlenecks and optimize training by visualizing compute time, memory usage, and input pipeline performance.
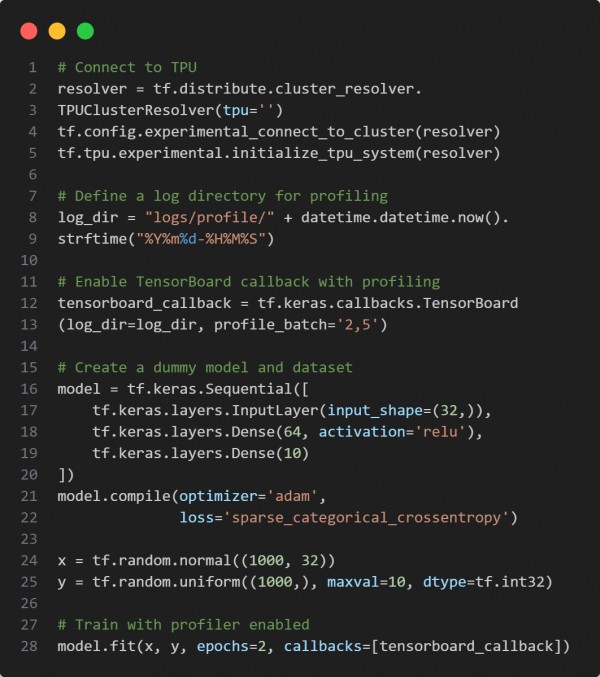
Here is the code snippet you can refer to:

In the above code, we are using the following key points:
-
profile_batch='2,5': Profiles only specific batches to reduce overhead.
-
log_dir: Stores performance logs for TensorBoard visualization.
-
TPUClusterResolver and TPU initialization: Ensures the model runs on TPU.
-
TensorBoard callback: Captures training metrics and hardware stats for TPU profiling.
-
Compatible with TensorBoard → "Profile" tab shows step-time breakdown, input pipeline analyzer, and more.
Hence, the TPU profiler allows fine-grained performance analysis, guiding targeted model and pipeline optimizations.
 REGISTER FOR FREE WEBINAR
X
 Thank you for registering
Join Edureka Meetup community for 100+ Free Webinars each month
JOIN MEETUP GROUP